While we were learning about water on the earth (what percent of it is salt water and what percent is freshwater), we checked out what percent of our bodies are actually water. The fact is that approximately 5/6 or 0.83 of our bodies are made up of water. What an intriguing thought. It certainly doesn’t feel that way. We decided to use this information to calculate how many gallons of water were in each of our bodies.
First we each multiplied our weight by 0.83 to find out how many of the pounds we carry around are water. Then we took that answer and divided it by 8.1 since that is how much one gallon of water weighs. The answer revealed how many gallons of water each of us had in our bodies. I had several gallon containers in the classroom so that it was easier to visualize the amounts. This in itself was interesting and generated quite a bit of discussion. But in my mind I was wondering how does the data collected in this class compare to others?
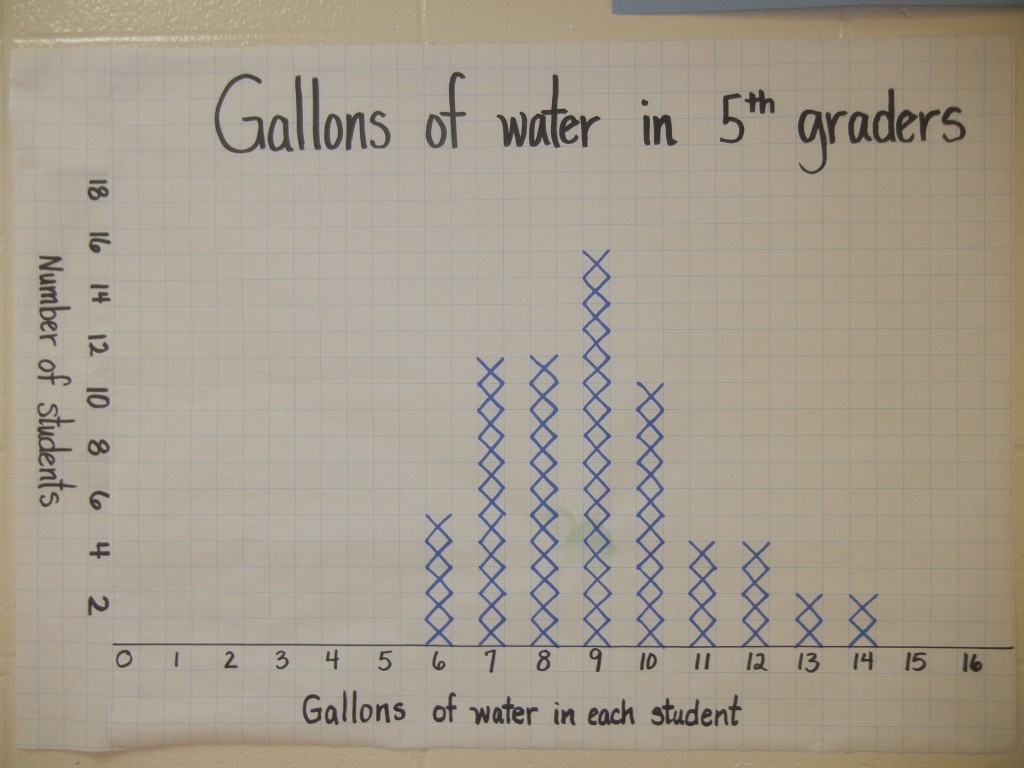
So I drew a line plot on the board and had the students place an “x” in the appropriate column (we rounded our amounts). After the first class had listed its data (I teach three classes), the students made some observations and noticed that most students had 9 gallons of water in their body. The minimum was 6 and the maximum was 14. The second class added their data to that of the first class so that we were building one huge line plot that represented the entire fifth grade.
By the end of the second class, the mode was no longer 9. Now 10 and 8 were tied for the mode. This in itself presented a marvelous opportunity to talk about sample size during investigations!
By the end of the third class, 9 was once more the mode, with 7 and 8 gallons being the second most popular totals. The maximum and minimum values did not change throughout the day.
After the students left for the day, I created a paper version of the line plot and erased the board. When they came in the next day, I announced that we were having an estimation contest. Who could come the closest to guessing how many gallons are in the bodies of all of our fifth graders? Some of the students immediately got out paper and began using what they remembered from yesterday to calculate a logical guess. Others just flat out guessed.
In the end, the first place winner guessed within 3 gallons and the second and third place winners (tied) were within 9 gallons. The prizes were brand new water bottles! I know. You could have guessed that, right? But now what….
As each class met, I let them make observations about our final line plot and the final total. Then I split them into small groups and had them generate questions. I wanted to teach them that making observations is great, but the questions you come up with are what take you to the next level. Great questions are why things are invented, discoveries are made and the understandings people have grow. Here are some of the questions the groups came up with:
1. How many total gallons would be in the students who attend our local high school?
2. If we calculated the water in all of the students and adults in our building, would the adults have more water or the students? (Knowing that there are more students than adults)
3. Would 9 gallons still be the mode if we used 4th graders or 3rd graders?
4. Our line plot was shaped kind of like a triangle. Would other grades have that too? Would any have line plot data shaped more like a wide rectangle? A tall rectangle?
5. How many gallons of water are in all of the people of the world?
6. How many gallons of water are in all of the people of Wisconsin?
7. How many schools full of people would hold the same amount of water as Lake Michigan?
8. How much more water does a woman have during a pregnancy?
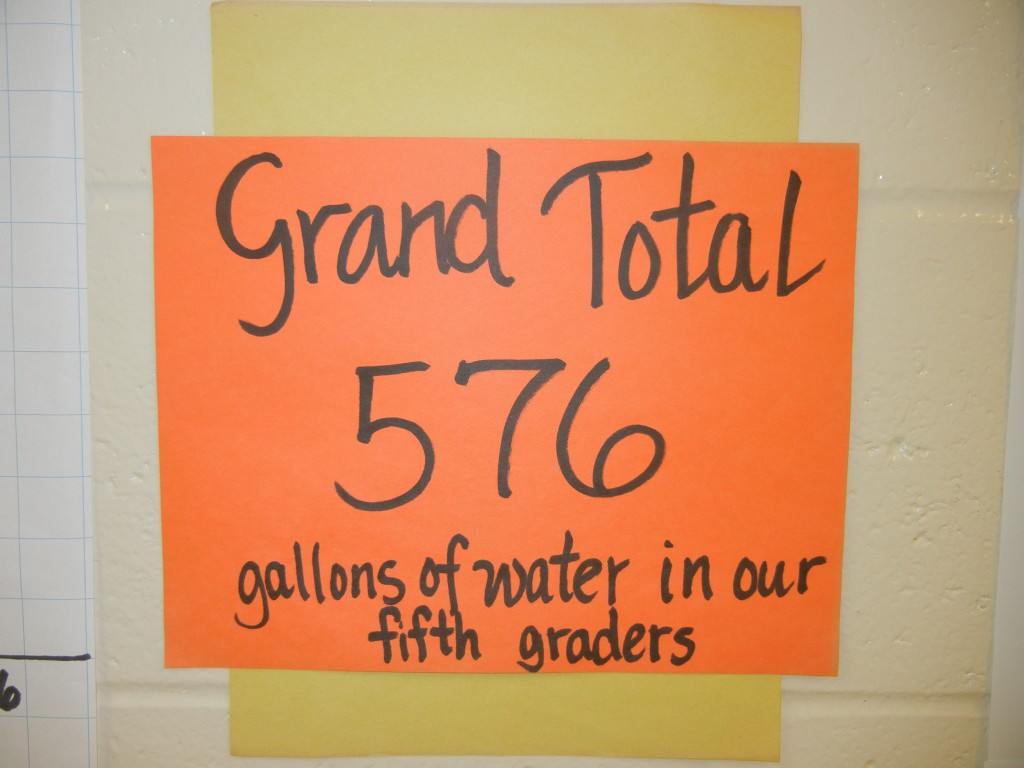
9. The fifth graders have 576 gallons of water in their bodies. How long would it take to drink that much water if you drank 64 ounces a day?
10. What would a line plot look like if the data was collected on newborn babies?
These questions brought such an energy to this simple activity! The discussions were captivating!
After listening to the students all day, I came up with my own question. How many fifth graders (the water in them) would it take to fill the school pool? I explained the next day how I went to the pool director and found out that our pool holds 240,000 gallons. If we round 576 to 600, that means that I would need to borrow Willy Wonka’s “juicing machine” (from Willy Wonka and the Chocolate Factory by Roald Dahl) and use it on 400 fifth graders to fill our pool! We all laughed, but found it interesting at the same time.